Non-invasive graphing of energy usage
“If you can’t measure it, you can’t improve it.”
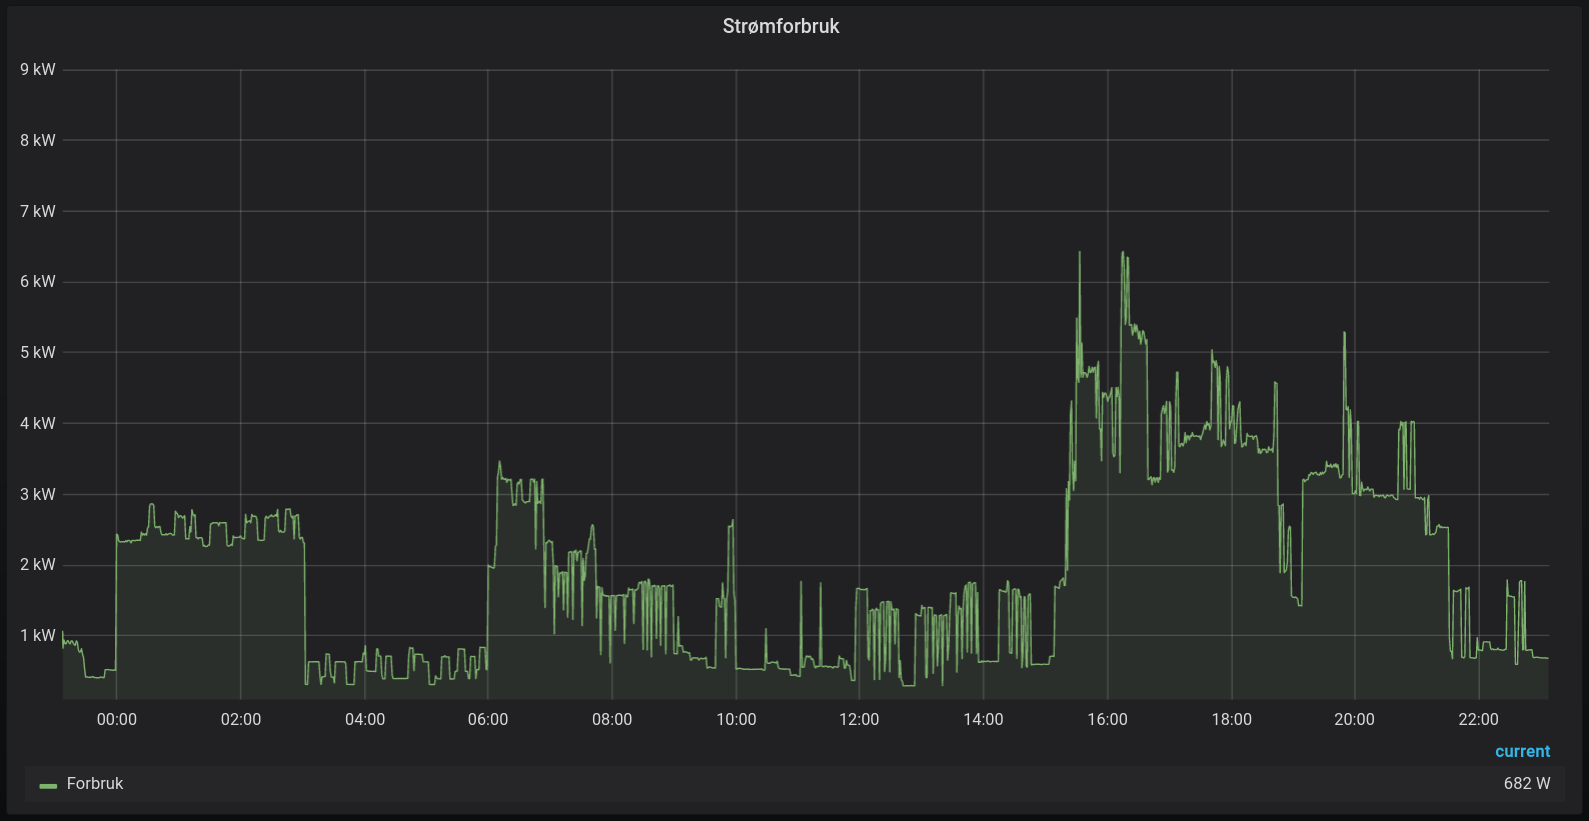
Reducing energy usage is hard if you can’t see it. Here’s a cheap way to graph home or office energy usage.
By reading data from the energy meter, one can get super accurate, real-time usage data.
I’ve used:
- A smart home controller, Home Assistant
- A graphing system, Grafana
- A micro controller, esp8266, ~$5
- An LDR sensor, $1
You need some familiarity with all of the above to set this up.
Here’s my energy meter:
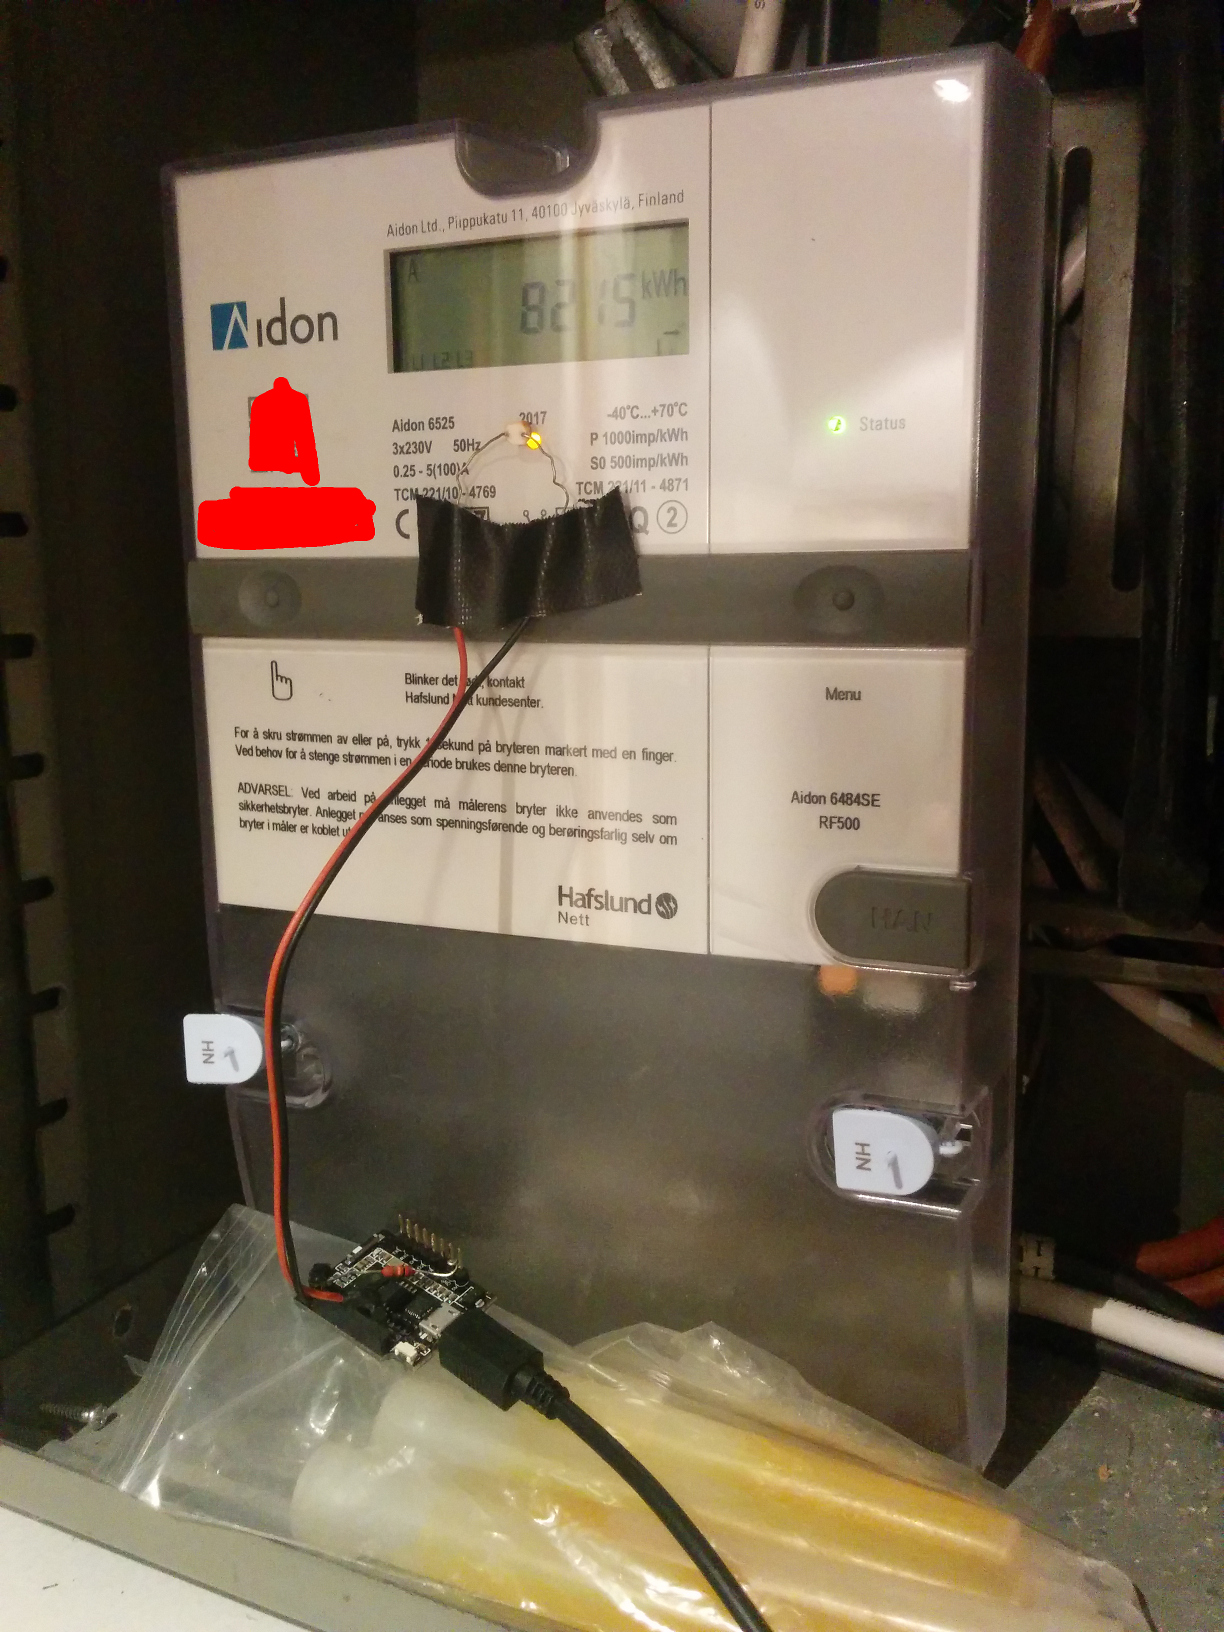
It doesn’t matter which one you have, as long as it has a LED that blinks each X kWh used. I’ve written software for the esp8266 in MicroPython, called esp_energy_meter, that measures the time between each blink. It works great, and I’ve had it running for several locations for years. See the gitlab repo for more info on setup.
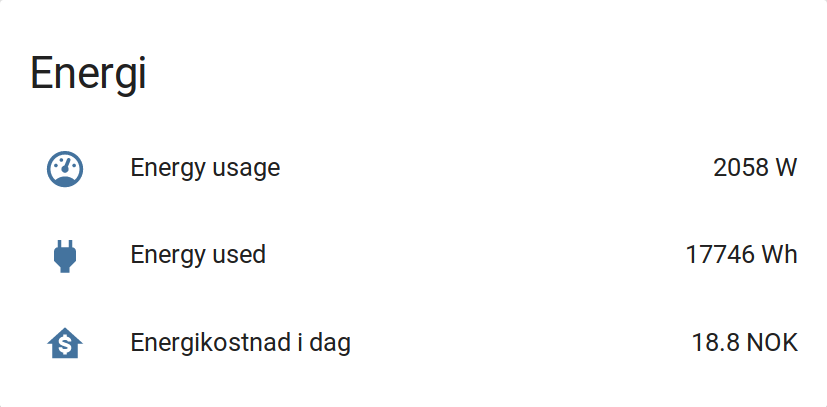
When you have this set up, you can combine it with real-time energy prices to get full control of your energy usage. And then it’s time to adjust your usage based on pricing. =)